All posts by The Smoky Cat

Heart Graph v4.4.1 released

Today we released Heart Graph v4.4.1, including:

  • Add live heart rate zone histogram to the phone during recording
  • Add ability to define annotation markers during workouts
  • Add option for coloured zone bands instead of coloured set types
  • Add option to display rolling mean during workout in place of total workout mean
  • Add option to vibrate on alarms as well as play a sound
  • Fix bug where app crashed if trying to save an image to the Camera Roll

Anaerobic threshold training session

In a previous article, we’ve discussed Training using heart rate zones, which gives some of the theoretical details about defining and using heart rate zones in your training. In this article, we take a look at how monitoring heart rate and the use of heart rate zones has supported a particular type of exercise session: 1 hour of cycling effort purely in the aerobic zones (Zones 1, 2 and 3). This type of training is particularly important for building endurance and preventing fatigue caused by exercising above your anaerobic threshold. When cycling, such a session can often be useful during the winter when getting out on the bike may be happening less frequently, and group rides are slower than they might be during the summer racing season.

To understand the session, let’s take a look at graph of heart rate against time for the 90 minutes or so this session took using the screenshot below. Initially the heart rate started around 100bpm, then during 20-25 minutes of warm up rose to around 155. By monitoring heart rate during their session, our cyclist was able to control their effort to ensure that the heart rate didn’t go above the anaerobic threshold (AT) boundary between Zone 3 and Zone 4 for any significant period of time during the main hour-long effort of the workout. After completing the work, a 5 minute cool-down easily brings the heart rate back to normal levels.AT_workout

This effort is then summarised in the bar graphs at the top of the screen, which show that just over 60 minutes is spent in Zone 3 (yellow), and that the only other significant time in the workout is spent in Zone 1 and Zone 2 (from the warm-up and cool-down periods). That pattern is the hall-mark of this kind of session – any significant time in Zone 4 or Zone 5 would be a sign that too much effort was being expended, and would like also show as a prolonged period required to bring heart rate back to normal levels at the end of the workout.

It’s interesting to note the two sharp spikes at around 19 and 22 minutes, which were recorded during the warm-up period. Our cyclist did these short bursts of near-max intensity to allow themselves to more easily get their heart rate up to the desired level for the actual work of the session. While this may not be true for everyone, our cyclist here finds that without a short burst of effort during the warm-up it can be difficult to comfortably maintain their heart rate near the anaerobic threshold, or indeed to even get it there in the first place!

Zooming in to the hour-long period of work gives even more detail to understand what happened during this session: as you would expect, it is hard to keep heart rate constant while training (even on a turbo-trainer!), and so it varies throughout the workout. However, our cyclist has carefully ensured that whenever it gets near the anaerobic threshold boundary they’ve eased off, and if it drops too low then a little more effort is put in.AT_Workout_Detail_H

Acknowledgements

Download_on_the_App_Store_Badge_US-UK_135x40All images shown in this article are screenshots taken showing actual data recorded by Heart Graph for iOS and Apple Watch. Find out more about the features of Heart Graph by viewing our Tutorial Videos.

About the author

Dr Thomas Wright, Director of Smoky Cat Software Ltd., studied at the University of Oxford, and has spent 1000s of hours rowing and coaching rowing, and road-cycle racing. As well as being Men’s captain of St Catherine’s College Boat Club in 1997/98, he also participated in the University Lightweights Summer Squad in 1998, competing in an eight at the Henley Royal Regatta. As a member of the Oxford City Road Club, he was awarded the Frank Wraight Memorial Trophy in 2003 as the club’s cycling road race champion.

Training using heart rate zones

When starting out with a training program, one of the questions people ask is whether they are getting the most from the efforts they’re putting in. A common problem is actually pushing too hard for too long, which unless carefully managed can lead to over-training, a situation that not only takes its toll on the body, but also means that your performance can actually decrease as you continue training in the same way.

Tabata_IntervalsA carefully designed training program for aerobic activities such as running, cycling or rowing will involve a mix of training activities, including shorter, high-intensity sessions such as intervals, long “steady state” sessions for building base fitness and the all-important active recovery sessions. These recovery sessions are essential to give your body the time it needs to adapt to the training you’ve been doing, and help ensure that you are rested enough to push yourself to the appropriate level in the other sessions within your program.  It can often be better to do a well-managed active recovery session than to take a day completely off.

One essential ingredient to making sure that you’re actually implementing the training plan you’re working with is heart rate monitoring. Heart rate can give you a good idea of how hard your body is actually working, although it is relative to your personal physiology and absolute numbers will depend on the type of activity you’re doing. Because heart rate will vary throughout your training session, to make sense of it we need a way of extracting some simpler representative values: that’s where heart rate zones come in.

The easiest way of defining heart rate zones is based on maximum heart rate, which can be crudely estimated as ( 220 – your age ), e.g., a 20 year old may have a max heart rate of 200bpm (beats per minute), while a 50 year old may have a max heart rate of 170bpm. Alternatively you can use other techniques to measure it more accurately, for example as described in this RunnersWorld article. Five heart rate zones could be defined as:

  • Zone 5: max * 0.9 and above (MAX)
  • Zone 4: max * 0.8 up to max * 0.9 (Anaerobic)
  • Zone 3: max * 0.7 up to max * 0.8 (Aerobic, Hard)
  • Zone 2: max * 0.6 up to max * 0.7 (Aerobic, Moderate)
  • Zone 1: max * 0.5 up to max * 0.6 (Aerobic, Easy)
  • max * 0.5 and below: ignored as not significant

So for a 20 year old, the zones would be:

  • Zone 5: 180bpm +
  • Zone 4: 160…180bpm
  • Zone 3: 140..160bpm
  • Zone 2: 120..140bpm
  • Zone 1: 100..120bpm
  • Below 100bpm: ignored

The boundary between Zone 3 and Zone 4 is particularly important as it defines the point at which your body switches from efficient, lower power aerobic activity to less efficient, but higher power anaerobic activity. While you can train aerobically for very long periods, if you train with your heart rate above your anaerobic threshold you will be limited to perhaps 30-60 minutes before exhaustion. Using our above definition of heart rate zones puts the anaerobic threshold at 80% of maximum heart rate, although it is possible to more accurately measure this value as described in this Sports Fitness Advisor article.

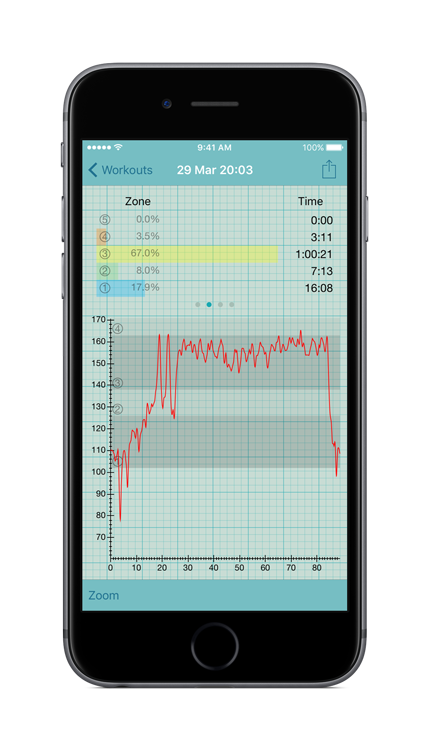
Having defined the zones and recorded your heart rate throughout your session, you can then calculate the total amount of time spent in each of the different zones. It doesn’t matter whether you spend 10 minutes in a zone in one go, or as 10 individual sections of 1 minute each; only the total matters. The important thing is that by looking in the total time spent in each of the zones, and also the proportion of the session spent in each zone, you can get an idea of how hard a session was.

As an example, the Apple Watch screenshot below shows a snapshot of the time spent in each heart rate zone during the first part of a fairly hard session: already in under 15 minutes over 3 minutes has been spent above the anaerobic threshold (AT), although the most time is spent in the moderate, aerobic Zone 2. Using this information during your workout can allow you to decide if you’re sticking to your plan, working too hard, or taking it too easy; appropriate adjustments can then be made.

Watch_Zones

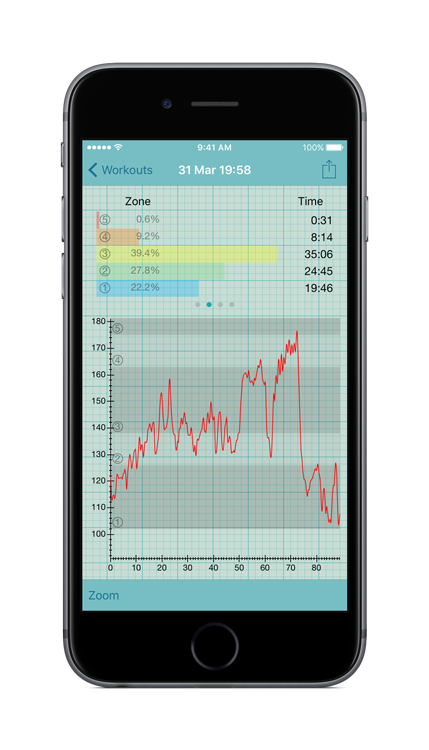
Different kinds of session should produce a zone breakdown with a different pattern: a steady state session would typically be spent in Zone 2 and Zone 3, and although an interval session should include time in Zone 5, there also needs to be time spent in the lower zones to allow for recovery in-between the intense bursts.  When doing an active recovery session, you should only have heart rate in Zone 1; anything more is too much and risks leading to over-training. Learning the patterns that are appropriate for you and your training regime can allow you to better understand your body and to optimise your sessions to maximise the benefits.

In future articles we will discuss how heart rate zones can apply to different kinds of workout sessions.

Acknowledgements

Download_on_the_App_Store_Badge_US-UK_135x40All images shown in this article are screenshots taken showing actual data recorded by Heart Graph for iOS and Apple Watch. Find out more about the features of Heart Graph by viewing our Tutorial Videos.

About the author

Dr Thomas Wright, Director of Smoky Cat Software Ltd., studied at the University of Oxford, and has spent 1000s of hours rowing and coaching rowing, and road-cycle racing. As well as being Men’s captain of St Catherine’s College Boat Club in 1997/98, he also participated in the University Lightweights Summer Squad in 1998, competing in an eight at the Henley Royal Regatta. As a member of the Oxford City Road Club, he was awarded the Frank Wraight Memorial Trophy in 2003 as the club’s cycling road race champion.

Heart Graph v4.0 released with native Apple Watch app

We are pleased to announce that Heart Graph v4.0 is now available on the App Store,  including our new native Apple Watch app:

  • See a graph of your heart rate on your wrist during your workouts
  • Record resting heart rate directly from the Watch
  • View heart rate zones on the Watch in real-time during your workout
  • Quickly review up to 12 hours of recent heart rate data in the History view

Watch_History

We’ve also been making improvements to the main app itself, building on the successful release of Heart Graph v3.10:

  • New Apple Watch mode to simplify the UI for Apple Watch users
  • New Analysis button for analysing heart rate zone data aggregated over days, weeks or months

iPhone-6s-Zone-Analysis

  • Add AirDrop support for transferring workouts between devices
  • You can now long press on a workout in the list to export to AirDrop or Dropbox
  • Simplification of Home screen – all comparison features are now behind the Compare Workouts button
  • Audio improvements for volume and Bluetooth headphones
  • Minor bug fixes and enhancements

More details can be found in our Press Release.

Heart Graph v3.10 released

We are pleased to announce that Heart Graph v3.10 is now available on the App Store. New features include:

  • Compare the graphs of entire workouts displayed on the same axes
  • Prevent the graph compressing during longer workouts by choosing to view a window onto only the most recent data
  • Minor UI enhancements, including use of more legible fonts and updated app icon
  • Now access email and Dropbox export settings directly from the Workout view
  • Allow resting heart rate recordings to be reset
  • Add min, mean and max heart rate values to the default notes for resting workouts
  • Prevent the app displaying an alert in the background if Bluetooth is turned off
  • Minor bug fixes and enhancements

This release builds on the successful release of Heart Graph v3.9 with Apple Watch support.

Heart Graph v3.9 released with support for Apple Watch

We are pleased to announce that Heart Graph v3.9 is now available on the App Store. New features include:

  • Import heart rate data for Workouts from the Health app. This feature provides support for the Apple Watch by allowing you to import, view and analyse heart rate data after your workout is completed
  • Import heart rate data for arbitrary time periods from the Health app. For example you can import an entire day of heart rate data from your Apple Watch or other Health enabled sensor
  • Now use Heart Graph to record your resting heart rate – just lie back, relax, and let the app record your minimum heart rate over a period of up to 10 minutes
  • Added help within the app (iPhone only) for new users getting started with Heart Graph
  • When using a Planned Workout, you can now see details of the next set coming up shortly after the previous one is complete, rather than waiting for the 10s countdown
  • Added the ability to change audio settings in the middle of a workout
  • Increase range of audio rep counting slider sensitivity
  • Minor bug fixes and enhancements

For more details, please see our press release.